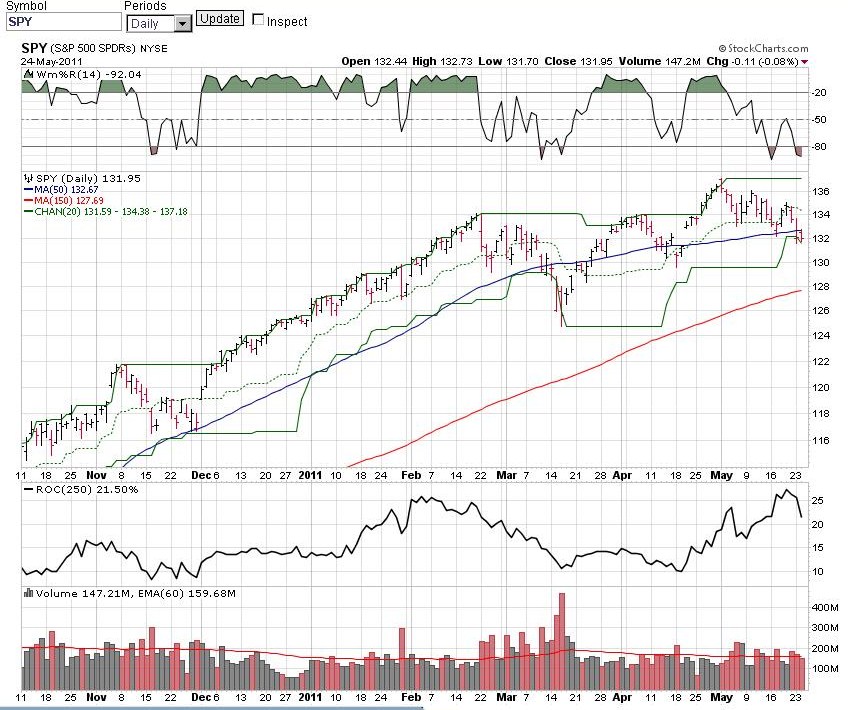
May 11, 2012: Market update: SPY (@ 136.02 prior to market open) is looking very bearish. See chart below for more details.


Interestingly, this chart looks similar to that of almost exactly a year ago:
In
both cases, the market had rallied from lows in October and November to
peaks in April - last year's chart was far more bullish because the
peak in April was taken out in May and the market managed to trade above
this level for a month or so.
As of late May, however, the market began breaking down and issued a sell signal when it violated its 20-day trailing low:
This was a timely sell signal, since the market collapsed in August, which has become a very weak and dangerous month:
The
market tried to rally but critically did not take out its 20-day high.
Note that markets rarely form V bottoms, rallying off of steep
declines. Instead, they tend to rally back, usually sharply and
dramatically. It is not uncommon for it to take out between a third
and a half of the sell-off (peak to trough), which is exactly what
happened here: the market sold off from 135 to 110 (25 points) then
rallied to the 122.5 areas - a retracement of almost exactly 50% of the
sell-off. Then it stalled, backed and filled, then broke down on a gap
on heavy volume:
Marching
forward, the market tried to rally again, failed, and found support at
its prior low (turning the V into a W). An aggressive, nimble trader (I
unfortunately am neither) could have taken a position at the market
close in early October when 3 things happened at once: 1.) the August
low was violated, but there was no follow-through (a failed sell signal -
bullish); 2.) the market set a new low but closed sharply higher for
the day (key reversal); 3.) the market was in a 2-b situation where the
sharp down trend-line was broken (1), the market failed to make a new
low (2), and was still very close to that new low. A stop could have
been placed either at the low of the day or where apparent support now
resided, just beyond the August low.
No comments:
Post a Comment