A collection of studies, articles, and data series I've collected over the years on stocks and options.
Showing posts with label gld. Show all posts
Friday, September 7, 2012
Wednesday, August 29, 2012
Market update: S&P 500 (SPY @ 141.40 before market open) continues to rally
The S&P 500 continues to show a nice, orderly advance, with higher highs and higher lows. The market action this year has been a textbook case in why trend-following works. Unfortunately, it's not always so simple. In fact, markets spend most of their times in trading ranges, not in clearly defined trends and of course trends are not clearly defined until after the fact. But when markets do trend and a trend has been declared, there is plenty of money to be made. You can never buy the bottom or sell the top, but you don't need to.
Take the action since January as an example. Following a break-out at 108.65 in October, 2011, (not shown), the S&P 500 didn't look back, rising 30%to 141.40 before triggering a sell signal (20 day trailing low) at just below 136 for a locked-in profit of 25%. Notice how the prior high of 141.40 proved to be almost the exact turning point for the aborted rally in late April, giving you an easy, nice double top. You could have shorted the market at this point with a buy stop (to cover your short) just above 141.40 and you would have had a nice 11% profit peak-to-trough. You would cover shortly after the gap up opening on the third trading day of June indicated the sell off below the prior low of 128.88 was false (a failed signal is the most powerful signal). Even if you entered on the close of that day or the open of the next, you would have covered your short and gone long at around 131, a respectable 7% profit in a little over a month. At any rate, the 20-day high would have gotten you into the market just above 133, after which point you would have shown as much as an 8% open profit (currently down a bit to 5.9%). So simply by using a brute force, mechanical system that didn't try to pretend it knew why the market was doing what it was, you would have been ahead 38% since October of last year (assuming you compounded your gains, changing your position size to reflect your increased profits), a bit more if you tried to anticipate using Sperandeo's "2b" highs and lows). Not bad for a mindless system that generated only 4 signals over that time period!Note that anyone who says that markets don't have memory need only look at this chart as pretty strong counter-proof. Markets as inanimate abstractions of course do not have memory, but the very human participants whose behavior is measured as market action do. They remember the pain of loss and the hope of further gain. They know exactly whether their break-even point is, and where they promise themselves to "get out even" (which is why prior recent highs are often resistance, or turn-around points for a rally as it morphs into a trading range). They experience the regret of missing the last rally, promising themselves they will buy if the market gets close to its last low, making that low a rallying point. Finally, they often realize very quickly when they get ahead of themselves, as they did following the market break-down below support in June, scrambling to cover their shorts or go long as the market gapped up above not just the new but the old low.
Note that anyone who says that markets don't have memory need only look at this chart as pretty strong counter-proof. Markets as inanimate abstractions of course do not have memory, but the very human participants whose behavior is measured as market action do. They remember the pain of loss and the hope of further gain. They know exactly whether their break-even point is, and where they promise themselves to "get out even" (which is why prior recent highs are often resistance, or turn-around points for a rally as it morphs into a trading range). They experience the regret of missing the last rally, promising themselves they will buy if the market gets close to its last low, making that low a rallying point. Finally, they often realize very quickly when they get ahead of themselves, as they did following the market break-down below support in June, scrambling to cover their shorts or go long as the market gapped up above not just the new but the old low.
Gold looks interesting....
The same principles can be applied, perhaps more profitably, to individual stocks, but my experience has been that individual stock trading is far more choppy and tends to issue far more false buy and sell signals than trading markets or sectors (through ETFs or mutual funds). If you like Apple, you are probably better off buying the technology sector (through XLK) if you want to sleep at night, but can do quite well if you are prepared for getting shaken out of a position several times for a loss before finally riding the big trend into the financial heavens.
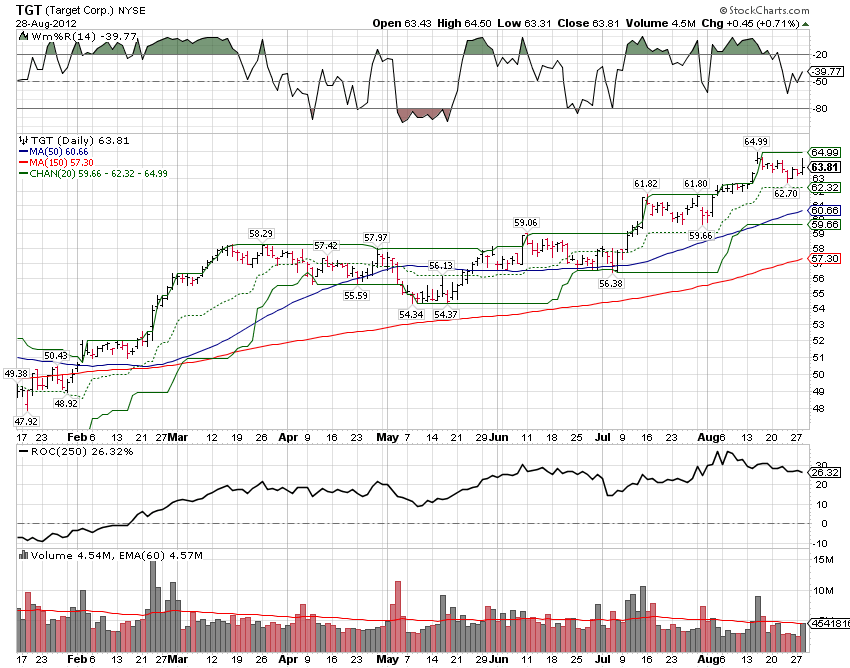
One company with a beautiful "trend-worthy" chart right now is Target (TGT). By the way, with stocks, I recommend doing some fundamental research, unlike with markets (where I believe fundamental research is often misleading or less than worthless). If you don't like pouring over balance sheets and income statements, then plenty of excellent third party vendors are available. Plenty of terrible ones are also, but two that have outstanding long-term records are Value Line (subscription only but most libraries subscribe, giving you free access) or Microsoft's Stock Scouter. The latter uses a quantitative method that ranks stocks into deciles (sort of) from one (worst) to 10 (best). Try to limit your choices for long stocks to 7-10. Target, when I bought, was a 7 (I will only sell on technicals even if I bought on a combination of technicals and fundamentals).
Why am I so enamored of Target? First, it's a great company that I use personally (the Peter Lynch approach). Second, it's got a good, solid fundamental ranking which means it merits further consideration. Third, its chart is beautiful.
Since its June breakout, TGT has had at least 3 distinctive trading ranges in an obvious staircase pattern with higher highs and higher lows. It looks as though it is ready to test its recent high around 65 after which one could anticipate this would form support of a new, higher trading range. Of course, it could fail that test, re-enter the current trading range and back and fill some more, or, a third possibility, sell off. But before it does option 3, it must first violate its 20-day low, currently at 59.66 (and soon to move much higher, giving you less risk).
More later...
Saturday, October 29, 2011
S&P 500 Breakout Confirmed (SPY @ 128.60)
29 Oct 2011: There are few things as satisfying as watching patterns worked out over the years play out in real time. After spending the week in Venice, I returned to find that re-entering the market in scale prior to our departure paid for our trip several times over:

SPY (128.60) is following through nicely on its breakout below 122.5 2 weeks ago. Volume is heavier on up days than down days - an encouraging sign - and it is making a pattern of generally higher highs and lower lows. The lows of the last 6 days are all above the breakout point.
I have reached the point in life where I generally ignore fundamental news, not because it is not important but because it is so unknowable. Markets discount the future, not the present, and most market bottoms occur when the news is bleakest and all hope seems lost. What is commonly misunderstood as callousness on Wall Street (the capital markets rallying while unemployment remains high) is simply the smart money recognizing that the market is improving and taking positions ahead of confirmation through improvement in, among other things, a drop in unemployment. In fact, the stock market remains one of the best leading economic indicators for that reason.
Focusing on the movement of prices and volume (technical analysis) almost exclusively is simply a recognition of some brutal market realities:
1.) most people, most of the time, are wrong; following the crowd is
2.) financial news, especially of the breathless variety, is beyond useless - it's distracting because its objective is not to inform but to entertain; if anyone really knew what was going on, they would not be standing with a microphone on the floor of the NYSE telling you what happened at 4:00 pm, but would have acted on that information before the market opened, quietly from a yacht in the Mediterranean (and it's unlikely they would be all that interested in sharing that information with you);
3.) when the minority of players who know what is going on act, they leave telltale signs on the markets in the form of volume and price action; these signs are of greatest use when they contradict the prevailing "wisdom" propagated by financial news;
4.) most financial letter writers, active mutual funds, and other so-called experts are better salesmen than investors; they make their money from selling subscriptions or charging fees for management; few outperform a passive index.
That being said, it does not mean all market action is random or that it is impossible to beat the market averages or consistently make money in all market cycles, only that it is emotionally very hard because it requires taking positions that are unpopular, even at times insane. Using a trend-following approach requires buying prices at relative highs after they have usually enjoyed a good rally (but often when they remain far below more distant highs), being wrong about as often as you are right (in terms of percentage of times a trade closes profitable), but making most of your money from a few trades, perhaps as few as 1 in 10. If your losses are much smaller on your losing trades than your gains on your winning ones, you will make a very comfortable living trading and enjoy the intellectual satisfaction that good fishermen and hunters have always known (which is why I think our brains evolved to be drawn to trading).
Enough philosophy. On to other markets:

Homebuilders also followed through on their rally on very strong up volume with much lower down volume. A very nice chart with a 15-20% pop from the breakout a few weeks ago. If high volatility like this makes you nervous, you can move your stop up to break-even (after commissions) or follow the 3-day low, which is often the first thing to be violated when a move is showing signs of exhaustion. If homebuilders double from here and you are stopped out at 15-20% you may deeply regret it, but that is the tradeoff. I would prefer to let the homebuilders run. My sense is the economy is much, much stronger than anyone anticipates and these things have a way of turning around much quicker than anyone realizes. Homebuilders have sold off so brutally (conventional wisdom says "everyone knows no Americans want to buy new homes and besides there is a huge backlog of foreclosed properties" but conventional wisdom and then some has long been priced into these stocks).

The Euro is another position I took recently I consider a no-brainer. With all the action near the top of the 20-day range and all the news about Greece and Italy so gloomy, something had to give. The markets said buy and I did. In the world of currencies where fortunes can be made with a 2 or 3% move, this 2% gap move up is huge (although I used the far less levered ETF here rather than futures for which I feel I am getting too old).

Switzerland mirrored Wall Street's action, performing a bit better actually over the past couple weeks. As a side note, if you want to take a position in a country, always choose a passively-traded, liquid iShares country web rather than an actively traded closed end fund whose share prices rise and fall not just on the underlying but on anticipations about the future direction of the underlying (as well as the wisdom of the active investors). Contrast the 10-15% pop since breakout here with the sell-off and then recover to breakeven of EWZ, for example.
As with any economic recovery, you would expect industrials to be roaring ahead and they are:
The fact that consumer staples is not doing quite as spectacularly is an indication smart money is shifting away from relatively safe plays into more economically-sensitive ones:

Technology continues to be choppy but moving in the right direction:

There is an old adage that no true bull market can exist unless led by financials. The performance of XLF, as much as I politically detest the behavior of the Marie Antoinettes in charge of these publicly-bailed-out companies, should be encouraging then:

I missed this when on vacation, but Gold has triggered a buy signal at 165 at almost the exact price you would have exited in September to close out a profitable trade from 152:

As always, stay tuned.
SPY (128.60) is following through nicely on its breakout below 122.5 2 weeks ago. Volume is heavier on up days than down days - an encouraging sign - and it is making a pattern of generally higher highs and lower lows. The lows of the last 6 days are all above the breakout point.
I have reached the point in life where I generally ignore fundamental news, not because it is not important but because it is so unknowable. Markets discount the future, not the present, and most market bottoms occur when the news is bleakest and all hope seems lost. What is commonly misunderstood as callousness on Wall Street (the capital markets rallying while unemployment remains high) is simply the smart money recognizing that the market is improving and taking positions ahead of confirmation through improvement in, among other things, a drop in unemployment. In fact, the stock market remains one of the best leading economic indicators for that reason.
Focusing on the movement of prices and volume (technical analysis) almost exclusively is simply a recognition of some brutal market realities:
1.) most people, most of the time, are wrong; following the crowd is
2.) financial news, especially of the breathless variety, is beyond useless - it's distracting because its objective is not to inform but to entertain; if anyone really knew what was going on, they would not be standing with a microphone on the floor of the NYSE telling you what happened at 4:00 pm, but would have acted on that information before the market opened, quietly from a yacht in the Mediterranean (and it's unlikely they would be all that interested in sharing that information with you);
3.) when the minority of players who know what is going on act, they leave telltale signs on the markets in the form of volume and price action; these signs are of greatest use when they contradict the prevailing "wisdom" propagated by financial news;
4.) most financial letter writers, active mutual funds, and other so-called experts are better salesmen than investors; they make their money from selling subscriptions or charging fees for management; few outperform a passive index.
That being said, it does not mean all market action is random or that it is impossible to beat the market averages or consistently make money in all market cycles, only that it is emotionally very hard because it requires taking positions that are unpopular, even at times insane. Using a trend-following approach requires buying prices at relative highs after they have usually enjoyed a good rally (but often when they remain far below more distant highs), being wrong about as often as you are right (in terms of percentage of times a trade closes profitable), but making most of your money from a few trades, perhaps as few as 1 in 10. If your losses are much smaller on your losing trades than your gains on your winning ones, you will make a very comfortable living trading and enjoy the intellectual satisfaction that good fishermen and hunters have always known (which is why I think our brains evolved to be drawn to trading).
Enough philosophy. On to other markets:
Homebuilders also followed through on their rally on very strong up volume with much lower down volume. A very nice chart with a 15-20% pop from the breakout a few weeks ago. If high volatility like this makes you nervous, you can move your stop up to break-even (after commissions) or follow the 3-day low, which is often the first thing to be violated when a move is showing signs of exhaustion. If homebuilders double from here and you are stopped out at 15-20% you may deeply regret it, but that is the tradeoff. I would prefer to let the homebuilders run. My sense is the economy is much, much stronger than anyone anticipates and these things have a way of turning around much quicker than anyone realizes. Homebuilders have sold off so brutally (conventional wisdom says "everyone knows no Americans want to buy new homes and besides there is a huge backlog of foreclosed properties" but conventional wisdom and then some has long been priced into these stocks).
The Euro is another position I took recently I consider a no-brainer. With all the action near the top of the 20-day range and all the news about Greece and Italy so gloomy, something had to give. The markets said buy and I did. In the world of currencies where fortunes can be made with a 2 or 3% move, this 2% gap move up is huge (although I used the far less levered ETF here rather than futures for which I feel I am getting too old).
Switzerland mirrored Wall Street's action, performing a bit better actually over the past couple weeks. As a side note, if you want to take a position in a country, always choose a passively-traded, liquid iShares country web rather than an actively traded closed end fund whose share prices rise and fall not just on the underlying but on anticipations about the future direction of the underlying (as well as the wisdom of the active investors). Contrast the 10-15% pop since breakout here with the sell-off and then recover to breakeven of EWZ, for example.
As with any economic recovery, you would expect industrials to be roaring ahead and they are:
The fact that consumer staples is not doing quite as spectacularly is an indication smart money is shifting away from relatively safe plays into more economically-sensitive ones:
Technology continues to be choppy but moving in the right direction:
There is an old adage that no true bull market can exist unless led by financials. The performance of XLF, as much as I politically detest the behavior of the Marie Antoinettes in charge of these publicly-bailed-out companies, should be encouraging then:
I missed this when on vacation, but Gold has triggered a buy signal at 165 at almost the exact price you would have exited in September to close out a profitable trade from 152:
As always, stay tuned.
Thursday, October 13, 2011
S&P 500 (@ 120.75) Issues Buy Signal - Proceed Cautiously
Tue 13 Oct 2011 before market open:

The S&P 500 has done something it hasn't since July - triggered a buy signal as measured by an intraday violation of the trailing 20-day high (yesterday at 121.99).
Technically, this is all we should need, mechanically following this signal, buying at a slightly lower price if we simply entered a market order today (assuming it doesn't gap at the open above the buy level, which is unlikely but possible).
As always with the market, however, there is a on-the-one-hand, on-the-other-hand quality to this buy signal.
Positives:
Volume on up days has been improving over the past 8 trading sessions;
3 closes above the 50 day moving average;
5 closes in the upper half of the 20-day trading range;
Last trading signal in this direction led to a (small) loss (bullish): although the last trading signal was a profitable short sell from 129 to 122, the last long signal generated a loss (from about 131 to 129). Believe it or not, this is bullish, and one Turtle Trading System insists that signals only be taken if the last signal generated (taken or not) would have led to a loss.
Negatives:
SPY was turned back at almost exactly the point where it met resistance twice before (in late September and mid-October);
Volume, although improving recently, is below average; for a true breakout, you would like to see a strong surge in volume accompanied by at or near the intraday high;
Short-term over-extended: the market has retraced half of the distance from the 110 closing low to the 135 high set in July; markets tend to find resistance after covering 1/3, 1/2, and 2/3 of the prior move (although this is a weak factor and certainly not always true).
The most likely scenario at this point is a pullback either to the 50-day (117.5) or the middle of the range (115) if not a test of the recent lows, but markets exist (or so it seems) to confound the most people most of the time, so a slog upwards from here with the market finding itself 20, 30, or 40% higher a few months from now is certainly possible. When markets bottom, it is not pretty, and the fundamental news usually remains awful (the reasons for the buying only become evident long afterwards which is why following the money by studying the charts works so much better than following the talking heads on CNBC).
At this point, an investor or trader true to the 20-day signal would go long at the market. A less aggressive trader would place a high above the high of this move (122.14) which would only be triggered if the market confirmed its buy signal and moved higher. Another way to enter the market would be to place a buy stop at the trailing 1- or 3-day high (take your pick), adjusting it every day as necessary. That way, if the market pulls back then turns around, you will likely get in at a lower price and not have to waste time (and lose sleep) fearing that you bought at the very top of a move (a risk with any trend-following system). Speaking of risk, there's quite a bit, over 12% if you use the 20-day low as your sell stop, 10% if you use the 20-day 110 closing low as your sell signal.
Other charts:
The dollar is pulling back with 2 unfilled down gaps after an initially impressive rally; this tends to be bearish for the stock market in the short-intermediate term:

Of course, part of this is simply a mirror index of the Euro, which is rallying apparently in relief to the Greece bailout plan:

Anything that helps Europe will ultimately be bullish for the United States also, since the Eurozone taken as a whole is about the same size as the United States economy and one of our greatest trading partners.
Gold has been hammered recently, gapping across its 20-day sell signal line at 165 in late September, and unable to rally up even to the bottom of the gap, much less filling it. That buy signal, however, gave a nice run from 151 in July to 165 in September or 9% in a little over 2.5 months.

Germany is breaking out nicely with follow-through:

You would like to see better volume, however, but you had some very strong up days in September and the first trading day of October, indicating net accumulation.
If you missed the Germany Web buy signal, you could always trade the Germany Fund (more of an active ETF rather than an attempt to mirror an index) which gave a buy signal on heavy volume:

Contrarians might keep an eye on solar energy (TAN @ 3.42) since the news out of this sector has been unrelentingly negative, distorted by a toxic political atmosphere (an attempt to highlight a failed $500 million investment in a much larger sector, an exception that does not prove the rule). Because this ETF is so low-priced, it is not marginable and many pension and mutual funds maybe prohibited from buying it (meaning that the usual drivers of an explosive upside rally may have to stay on the sidelines), but for the individual retail investor or trader, this ETF maybe starting to get ready to rally. I wouldn't bite here, but the fact it found support at 3 after such a brutal sell-off from 9, and on heavy volume no less, warrants close watching:

Of the sectors making up the S&P 500, only a few have triggered buy signals, notably excluding financials and energy.
Technology is a stand-out but up volume remains anemic and following the breakout yesterday, it closed at the lows of the day:

One bullish thing about technology is that it gave a recent false buy signal leading to about a 10% loss, which again is bullish, but the trading range is wide and sloppy.
The Swiss Franc, after getting hammered, gapping down a staggering (in currency terms) 10 points from 125 to 115 in early September, has not even been able to approach the lower part of this gap and volume on down days remains much higher than on up days:

The Swiss stock market has issued a buy signal, however:

Not for the faint of hart, the ETF that attempts to mirror the VIX (volatility index) looks as though it is approaching a sell signal after a fantastic trade was triggered at 25; if it does not gap below 41.35, then this would be a 65% profit in a little over 2 months. The fact that volatility is settling down is settling down, or at least approaching lower end of its elevated trading range, maybe a sign that things are returning to normal, or at least that the panic levels of volatility recently seen are backing off.
The S&P 500 has done something it hasn't since July - triggered a buy signal as measured by an intraday violation of the trailing 20-day high (yesterday at 121.99).
Technically, this is all we should need, mechanically following this signal, buying at a slightly lower price if we simply entered a market order today (assuming it doesn't gap at the open above the buy level, which is unlikely but possible).
As always with the market, however, there is a on-the-one-hand, on-the-other-hand quality to this buy signal.
Positives:
Volume on up days has been improving over the past 8 trading sessions;
Volume on the first trading day of October surged higher, at which time
SPY made a low of 107.5 then closed 5% higher just below 112.5 AND
Gave a failed sell signal, making a
new relative low, then reversing and closing higher;
7 days of higher lows and higher highs in a row; 3 closes above the 50 day moving average;
5 closes in the upper half of the 20-day trading range;
Last trading signal in this direction led to a (small) loss (bullish): although the last trading signal was a profitable short sell from 129 to 122, the last long signal generated a loss (from about 131 to 129). Believe it or not, this is bullish, and one Turtle Trading System insists that signals only be taken if the last signal generated (taken or not) would have led to a loss.
Negatives:
SPY was turned back at almost exactly the point where it met resistance twice before (in late September and mid-October);
Volume, although improving recently, is below average; for a true breakout, you would like to see a strong surge in volume accompanied by at or near the intraday high;
Short-term over-extended: the market has retraced half of the distance from the 110 closing low to the 135 high set in July; markets tend to find resistance after covering 1/3, 1/2, and 2/3 of the prior move (although this is a weak factor and certainly not always true).
The most likely scenario at this point is a pullback either to the 50-day (117.5) or the middle of the range (115) if not a test of the recent lows, but markets exist (or so it seems) to confound the most people most of the time, so a slog upwards from here with the market finding itself 20, 30, or 40% higher a few months from now is certainly possible. When markets bottom, it is not pretty, and the fundamental news usually remains awful (the reasons for the buying only become evident long afterwards which is why following the money by studying the charts works so much better than following the talking heads on CNBC).
At this point, an investor or trader true to the 20-day signal would go long at the market. A less aggressive trader would place a high above the high of this move (122.14) which would only be triggered if the market confirmed its buy signal and moved higher. Another way to enter the market would be to place a buy stop at the trailing 1- or 3-day high (take your pick), adjusting it every day as necessary. That way, if the market pulls back then turns around, you will likely get in at a lower price and not have to waste time (and lose sleep) fearing that you bought at the very top of a move (a risk with any trend-following system). Speaking of risk, there's quite a bit, over 12% if you use the 20-day low as your sell stop, 10% if you use the 20-day 110 closing low as your sell signal.
Other charts:
The dollar is pulling back with 2 unfilled down gaps after an initially impressive rally; this tends to be bearish for the stock market in the short-intermediate term:
Of course, part of this is simply a mirror index of the Euro, which is rallying apparently in relief to the Greece bailout plan:
Anything that helps Europe will ultimately be bullish for the United States also, since the Eurozone taken as a whole is about the same size as the United States economy and one of our greatest trading partners.
Gold has been hammered recently, gapping across its 20-day sell signal line at 165 in late September, and unable to rally up even to the bottom of the gap, much less filling it. That buy signal, however, gave a nice run from 151 in July to 165 in September or 9% in a little over 2.5 months.
Germany is breaking out nicely with follow-through:
You would like to see better volume, however, but you had some very strong up days in September and the first trading day of October, indicating net accumulation.
If you missed the Germany Web buy signal, you could always trade the Germany Fund (more of an active ETF rather than an attempt to mirror an index) which gave a buy signal on heavy volume:
Contrarians might keep an eye on solar energy (TAN @ 3.42) since the news out of this sector has been unrelentingly negative, distorted by a toxic political atmosphere (an attempt to highlight a failed $500 million investment in a much larger sector, an exception that does not prove the rule). Because this ETF is so low-priced, it is not marginable and many pension and mutual funds maybe prohibited from buying it (meaning that the usual drivers of an explosive upside rally may have to stay on the sidelines), but for the individual retail investor or trader, this ETF maybe starting to get ready to rally. I wouldn't bite here, but the fact it found support at 3 after such a brutal sell-off from 9, and on heavy volume no less, warrants close watching:
Of the sectors making up the S&P 500, only a few have triggered buy signals, notably excluding financials and energy.
Technology is a stand-out but up volume remains anemic and following the breakout yesterday, it closed at the lows of the day:
One bullish thing about technology is that it gave a recent false buy signal leading to about a 10% loss, which again is bullish, but the trading range is wide and sloppy.
The Swiss Franc, after getting hammered, gapping down a staggering (in currency terms) 10 points from 125 to 115 in early September, has not even been able to approach the lower part of this gap and volume on down days remains much higher than on up days:
The Swiss stock market has issued a buy signal, however:
Not for the faint of hart, the ETF that attempts to mirror the VIX (volatility index) looks as though it is approaching a sell signal after a fantastic trade was triggered at 25; if it does not gap below 41.35, then this would be a 65% profit in a little over 2 months. The fact that volatility is settling down is settling down, or at least approaching lower end of its elevated trading range, maybe a sign that things are returning to normal, or at least that the panic levels of volatility recently seen are backing off.
Friday, September 23, 2011
Chart Review 9/23/11 (SPY @ 112.86 before market open) - the ugliness continues.
Market Indexes (with yesterday's change and % change):
SPY 112.86 -3.77 -3.34% (short since 129, 14% open profit)
DJI 10,733.83 -391.01 -3.64%
ETFs with the lowest % risk (closest to stop loss point):
ishares 1-3 short at 84.59. BS @ 84.74. 0.2% risk.
SPDR consumer staples long at 29.44. SS @ 29.14. 1% risk.
UltraShort Health Care short at 26.99. BS @ 27.4. 1.5% risk.
SPDR Consumer Discretionary long at 35.2. SS @ 34.63. 1.6% risk.
Gold Shares Trust long at 169.05. SS @ 165.88. 1.9% risk.
Dollar ETF long at 22.26. SS @ 21.5. 3.5% risk.
SPDR technology long at 23.73. SS @ 22.91. 3.6% risk.
SPDR utility long at 33.08. SS @ 31.91. 3.7% risk.
ishares 7-10+ Treas Bond Fund long at 106.41. SS @ 102.38. 3.9% risk.
Euro ETF short at 134.24. BS @ 141. 5% risk.
UltraShort Consumer Services short at 20.71. BS @ 22.1. 6.7% risk.
iShares Canada short at 25.64. BS @ 27.5. 7.3% risk.
Swiss Helvetica short at 11.01. BS @ 11.93. 8.4% risk.
Proshares Short Dow 30 long at 45.36. SS @ 41.81. 8.5% risk.
Templeton Global Income Fund short at 9.92. BS @ 10.82. 9.1% risk.
SPY short at 112.86. BS @ 123.51. 9.4% risk.
iShares China short at 31.53. BS @ 35. 11% risk.
UltraShort Technology short at 62.33. BS @ 69.36. 11.3% risk.
iShares Germany short at 17.52. BS @ 19.5. 11.3% risk.
iShares Hong Kong short at 14.95. BS @ 16.7. 11.7% risk.
BP short at 35.73. BS @ 39.95. 11.8% risk.
ishares 20+ Treas Bond Fund long at 123.12. SS @ 110. 11.9% risk.
Swiss Franc ETF short at 108.9. BS @ 122. 12% risk.
Greatest % Declining ETFs:
Templeton Dragon Fund TDF 23.25 -1.97 -8.47%
iShares Latin America ILF 38.71 -2.74 -7.08%
iShares China FXI 31.53 -2.14 -6.79%
Templeton Emerging Markets EMF 17.01 -1.12 -6.58%
Solar Energy ETF TAN 3.56 -0.23 -6.46%
Oil OIL 20.24 -1.27 -6.27%
SPDR energy XLE 59.34 -3.55 -5.98%
SPDR materials select XLB 30.29 -1.80 -5.94%
iShares Canada EWC 25.64 -1.44 -5.62%
Thai Fund TTF 12.32 -0.54 -4.38%
iShares Germany EWG 17.52 -0.75 -4.28%
SPDR homebuilders XHB 13.26 -0.55 -4.15%
iShares Hong Kong EWH 14.95 -0.62 -4.15%
iShares Malaysia EWM 12.10 -0.48 -3.97%
SPDR industrial select XLI 29.01 -1.13 -3.90%
iShares Singapore EWS 11.07 -0.37 -3.34%
SPY SPY 112.86 -3.77 -3.34%
Greatest % Increasing ETFs:
UltraShort Basic Materials SMN 26.39 2.95 11.18%
Proshares Ultrashort China FXP 44.20 4.61 10.43%
UltraShort Oil & Gas DUG 39.23 3.85 9.81%
VXX VXX 49.84 4.63 9.29%
UltraShort Health Care RXD 26.99 2.18 8.08%
UltraShort Industrials SIJ 62.91 4.46 7.09%
UltraShort Consumer Services SCC 20.71 1.26 6.08%
UltraShort Technology REW 62.33 3.71 5.95%
Proshares Ultrashort S&P 500 SDS 25.73 1.47 5.71%
UltraShort Financials SKF 88.06 4.80 5.45%
UltraShort Semiconductors SSG 57.81 3.15 5.45%
UltraShort Consumer Goods SZK 26.20 1.30 4.96%
UltraShort Real Estate SRS 17.25 0.79 4.58%
ishares 20+ Treas Bond Fund TLT 123.12 4.46 3.62%
Proshares Short Dow 30 DOG 45.36 1.52 3.35%
Dollar ETF UUP 22.26 0.23 1.03%
ishares 7-10+ Treas Bond Fund IEF 106.41 0.98 0.92%
ishares 1-3 SHY 84.59 0.01 0.01%
Wednesday, May 25, 2011
S&P 500 Triggers Sell Signal
25 May 2011 (prior to market open): The S&P 500 (SPY @ 131.95) triggered a sell signal on Monday, closing below its 20 day trailing low. Down volume has been heavier than up volume and the longer term trend is down:
Russia is getting clobbered.
The Euro has been hit hard by Greek debt problems as well as rumors that additional rounds of aid or even debt restructuring will be needed in Ireland, Portugal, or Spain.
Japan (EWJ @ 9.98) illustrates a few things. First: never try to catch a falling knife (guess a bottom). When a market panics following a catastrophe, as it did following the earthquake and tsunami and nuclear disaster in March, buyers appeared as the market approached 9.40, 20% below the pre-earthquake peak above 11.60. But the down gap was not filled (and the top of the gap formed resistance for the rally) and sellers drove the market down to the 9.70 area.
Another rally in late April looked promising and even triggered a buy signal, violating the 20 day trailing high, but it was turned back at 10.64, the same price level the abortive late March rally had failed. The market is now in a sell state but this could change - expect lots of back-and-forth sloppy trading as people jostle to figure out how to discount Japan going forward but the fundamental news is not good and does not appear to be getting better anytime soon, and evidence that if anything the damage to the nuclear reactors was initially understated (so whatever reports are issued now should be treated with skepticism).
Usually when markets fall off a cliff like this, the technical damage takes much longer than a couple months to repair.
Technology (XLK @ 25.72) has also broken down, triggering a sell signal.
Homebuilders (XHB @ 18.12): ditto.
The dollar is rallying and although the intermediate trend remains down, there are several bullish things to note:
- all the price action since mid-May has been in the upper part of its 20-day range after two thrust days up;
- buy signal May 15 after 20 day high penetrated to the upside;
- 3 recent closes above the 50 day moving average.
Please note: if you are US investor, you already by definition have all the exposure to the dollar you could ever want; I track the UUP for illustrative purposes only.
With so many sectors turning south, it should be no surprise that some short funds and ETFs have triggered buy signals. Ultrashort Semiconductors (SSG @ 48.12) looks very bullish here for a few reasons:
- following a protracted down trend (meaning an uptrend in semiconductor stocks), a buy signal was given that led to a small loss - this is normal following a protracted move, and taking the second trade against the prior trend is often far more profitable than the first;
- excellent support at 42.95, the 20-day low;
- Vic Sperandeo 2b bottom with broken downtrend line.
Fundamentals are favorable (meaning they are bearish for semis) with disruption of production in Japan and some signs of a slowdown in economic activity (semis go into everything from cars to computers, which are all highly cyclical).
Real estate looks interesting after a long bull leg up, it appears poised to at least give a good trading rally down (meaning that going short real estate through SRS @ 14.63 could be a good play).
Another beautiful chart.
If you want to short the S&P 500, this is as good a vehicle as any.
Gold is a more ambiguous chart; usually it is inversely related to the dollar but with money fleeing the Euro and all sovereign currencies (except perhaps the Swiss franc) looking shaky, gold may continue its up leg. However, the spike high in April and very heavy volume sell-off in May will probably present resistance as sellers who did not get out then will look for opportunities to get out at better prices. Technically, however GLD is still in a buy state without having its 20-day low violated.
What's not to like about the Swiss Franc? As fears of another EU bailout of Greece and probable restructuring of Greek debt rattles that currency, driving it down to the 1.23 area from above 1.5 recently versus the CHF (something I know viscerally, having just visited Paris and benefiting from my stronger "home" currency), with the United States a fiscal mess following disastrous tax cuts and ideological opposition to reversing them, as well as massive military and now stimulus spending, Switzerland, with a humming economy (with a growing trade surplus) running a very disciplined $3 billion government surplus seems the only game in town if you are looking for a rock solid place to park your money. Some exporters and many trade unions are nervous about the high CHF which may hurt exports and therefore the Swiss economy, but so far this has not been the case, with so many Swiss products value-added ones that have very little sensitivity to currency fluctuations (as may be the case with commodities, let's say). If you want a Swatch or a precision piece of machinery or specialty chemical, you just can't get it anywhere else.
Another rally in late April looked promising and even triggered a buy signal, violating the 20 day trailing high, but it was turned back at 10.64, the same price level the abortive late March rally had failed. The market is now in a sell state but this could change - expect lots of back-and-forth sloppy trading as people jostle to figure out how to discount Japan going forward but the fundamental news is not good and does not appear to be getting better anytime soon, and evidence that if anything the damage to the nuclear reactors was initially understated (so whatever reports are issued now should be treated with skepticism).
Usually when markets fall off a cliff like this, the technical damage takes much longer than a couple months to repair.
Another interesting short idea with terrific looking chart is the Proshares Ultrashort Oil & Gas (one of the most creatively-tickered ETFs, DUG, @ 29.52). You have a long, broken downtrend line, all of the recent action concentrated above the broken downtrend line and the 50-day moving average and up volume heavier than down volume. The April buy signal was false, leading to a short, small loss, which means the next buy signal, triggered in early May, is more likely statistically to be profitable.*
Stay tuned!
* Note that this is NOT a restatement of the gambler's fallacy, the belief that a fair coin flipped heads 2 or 3 times is more likely to come up tails on the next flip (it isn't, since each flip is statistically independent of the one prior and is always 50%). However, markets, unlike coins, have memory because the market participants have memory. Click here for more.
Subscribe to:
Posts (Atom)