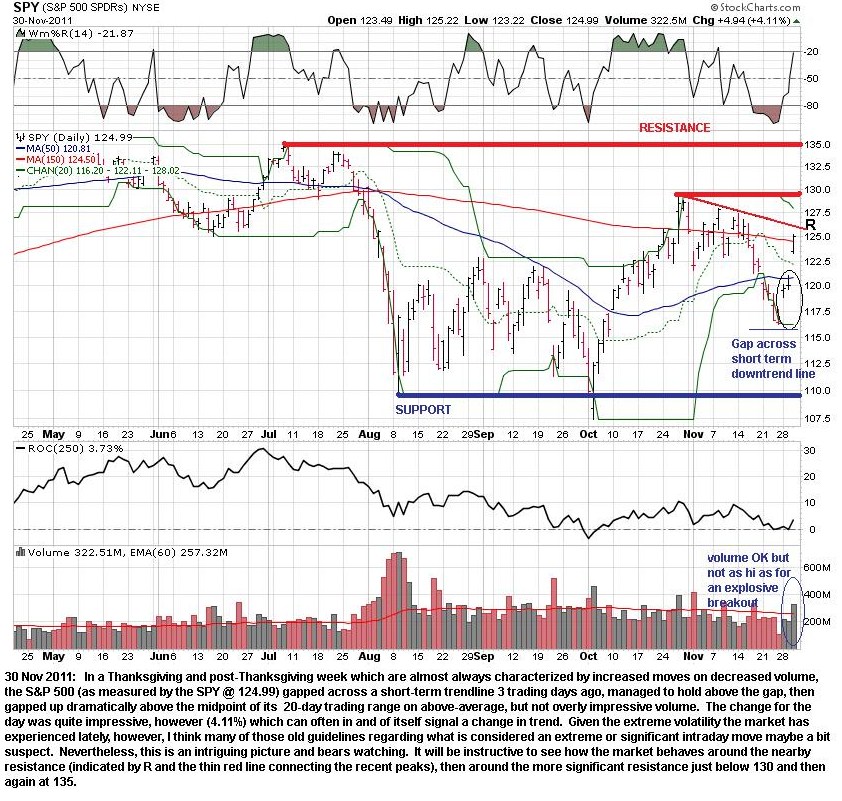
S&P 500 (SPY @ 126.26) rally looks vulnerable
Wed 7 Dec 2011 before the market open

If you view a chart from left to right as a sort of motion picture, you can sometimes envision - with a little imagination and squinted eyes - price as a rocket (or a brick) attempting to take off (or starting to plunge). The analogy breaks down because there is no equivalent of ground, a final resting place, where all the kinetic energy of the object is spent, but at times, you can almost hear the groaning of the imaginary ground control crew as the rocket slows its ascent, stalls, then begins to sink back toward its launching point.
It's possible we are at such a point now. I have annotated in red some of the most salient bearish factors:
- an apparent stalling just where you would expect if a rally were to fail - below intermediate term resistance at around 130, as well as a longer-term (but somewhat more imaginative, hence suspect) trendline connecting all the peaks since July;
In blue, I have annotated the bullish features:
- strong support at 110 (limiting risk somewhat if the rally fails);
- two unfilled gaps up with follow-through;
- most of the price action is in the top half of the trading range.
In black, I have indicated the most troublesome but still neutral indicator:
- volume on up days, although generally higher than on down days in the past several trading sessions is below average and waning; buyers do not appear to be rushing in and accumulating big positions as you would see before or shortly after a true breakout.
Other bullish factors to consider:
- seasonality - December remains the strongest month of the year and end-of-year rallies are common and often surprisingly strong;
- negativity in the news - although a little toned-down in the past few days, does anyone really think the problems in Italy, Spain, and Greece, to name a few, have just gone away? Add to that continued malaise in the United States job market, and it's only a matter of time before some awful number or piece of bad news makes everyone panic again. As a contrarian, negative economic and financial news is a positive.
So, we have a classic on the one hand, on the other hand situation. I remain flat and waiting for confirmation or a pullback. The market remains in a sell state until 128.02 (the 20-day high) is hit, and the possibility of a significant pullback before then looks high. Stay tuned.
Wed 7 Dec 2011 before the market open
If you view a chart from left to right as a sort of motion picture, you can sometimes envision - with a little imagination and squinted eyes - price as a rocket (or a brick) attempting to take off (or starting to plunge). The analogy breaks down because there is no equivalent of ground, a final resting place, where all the kinetic energy of the object is spent, but at times, you can almost hear the groaning of the imaginary ground control crew as the rocket slows its ascent, stalls, then begins to sink back toward its launching point.
It's possible we are at such a point now. I have annotated in red some of the most salient bearish factors:
- an apparent stalling just where you would expect if a rally were to fail - below intermediate term resistance at around 130, as well as a longer-term (but somewhat more imaginative, hence suspect) trendline connecting all the peaks since July;
In blue, I have annotated the bullish features:
- strong support at 110 (limiting risk somewhat if the rally fails);
- two unfilled gaps up with follow-through;
- most of the price action is in the top half of the trading range.
In black, I have indicated the most troublesome but still neutral indicator:
- volume on up days, although generally higher than on down days in the past several trading sessions is below average and waning; buyers do not appear to be rushing in and accumulating big positions as you would see before or shortly after a true breakout.
Other bullish factors to consider:
- seasonality - December remains the strongest month of the year and end-of-year rallies are common and often surprisingly strong;
- negativity in the news - although a little toned-down in the past few days, does anyone really think the problems in Italy, Spain, and Greece, to name a few, have just gone away? Add to that continued malaise in the United States job market, and it's only a matter of time before some awful number or piece of bad news makes everyone panic again. As a contrarian, negative economic and financial news is a positive.
So, we have a classic on the one hand, on the other hand situation. I remain flat and waiting for confirmation or a pullback. The market remains in a sell state until 128.02 (the 20-day high) is hit, and the possibility of a significant pullback before then looks high. Stay tuned.