SPY (131.32) forming possible flag
Wednesday, February 01, 2012 [see February 2 update]
In my last post ("SPY (@ 131.46) confirms rally to the upside (for now)"), I pointed out that the breakout was confirmed to the upside and should be played cautiously. Since then, the market rallied almost to the 135 area, then pulled back on average volume (although notably (bearishly) higher volume than 9 out of 10 of the last up days) to about where it was then.
As always, markets never give unambiguous signals (and when they do, they are often misleading); instead, we are forced to weigh the bullish factors against the bearish ones:
Bullish:
[Update: February 2, 2012 (before market open)
This flag was probably too short to really call it one, and the breakout to the upside should be bullish, but the market closed well off its highs which were exactly where it met resistance 4 trading sessions ago. Volume remains unimpressive for a true breakout but at least is higher than 4 of the 5 last down days. Stay tuned; a decisive break above 133 then 135 could lead to a nice rally, but the market seems to be stalling here at least in the short term although the 20-day buy signal remains in place with a stop at 126.43.
Wednesday, February 01, 2012 [see February 2 update]
In my last post ("SPY (@ 131.46) confirms rally to the upside (for now)"), I pointed out that the breakout was confirmed to the upside and should be played cautiously. Since then, the market rallied almost to the 135 area, then pulled back on average volume (although notably (bearishly) higher volume than 9 out of 10 of the last up days) to about where it was then.
As always, markets never give unambiguous signals (and when they do, they are often misleading); instead, we are forced to weigh the bullish factors against the bearish ones:
Bullish:
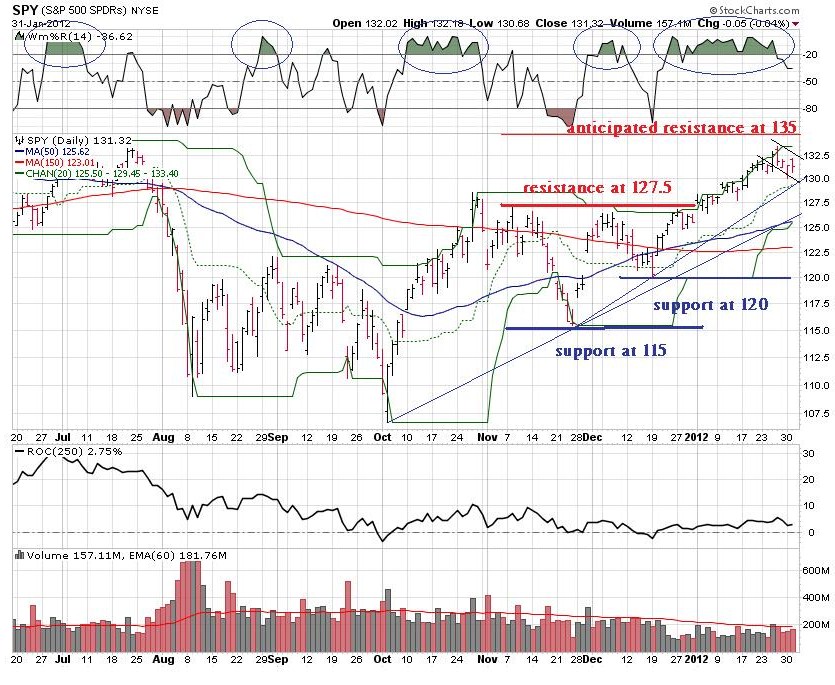
Possible flag forming at upper end of range near anticipated resistance; there is an adage that "the flag flies at half mast" meaning that on average flags mark a pause rather than an interruption of a trend and more often than not occur about what turns out to be the halfway point of a rally - if so, that would project the rally continuing another 7.5 points (I usually project these things from the bottom of the flag which would put us at about 138.5). This is a very crude measure however and is in no way a prediction. Flags' main utility is in giving us a low risk entry point, since the stop can be placed just below the flag (if it breaks to the downside).
Market closing in the upper end of its daily range. Although the past few sessions have been down, they have managed to claw back from their lows, indicating underlying strength.
Gloomy economic news: worries about the EU and the approaching Greek default (whatever you call it, paying back investors 50% on the dollar is a de facto default), a possible oil shock from Iran, and mixed news on the US economic front (income rose but consumption didn't; housing prices fell 3 straight months in a row, but jobless claims and unemployment surveys are showing strength); gloomy news is actually bullish for markets (markets tend to top when the news is most euphorically upbeat and bottom when everyone seems to have given up hope that things will ever get better).
Bearish:Rally is overextended: Check out the Williams %R oscillator, which is a measure of how "overbought" or "oversold" a market is. It is a very short-term indicator and should generally be used in a counter-trend way (that is buying an "oversold" market that is rallying or selling an "overbought" one that other indicators show is declining), and will remain needled up during an extended rally, but notice that past periods of several weeks of overbought have been followed by declines. The market spent 6 weeks in an overbought state by this indicator, and has sold off some since then; prior dips below -20 after extended periods above have been indicated by weak or choppy markets for the next several weeks or months.
Volume on down days is greater than volume on up days, with both being below average. A true rally should show accumulation (much stronger volume on up days than on down days indicating more buyers than sellers and the accumulation of large positions by pensions, hedge funds, and market insiders).
Nearby resistance at 135. The market is stalling just below resistance at 135, based on a projection of the height of the base added to the breakout point. This crude measure is surprisingly accurate. Like anything else, it should not be used alone but since the chart itself shows strong resistance just below this area (the July highs before the 20% sell-off to the August and October lows), so it would not be unreasonable to anticipate resistance here.
February tends to be a weak month. The average February percentage change of the S&P 500 since 1950 has been only 0.03% (versus 0.68% for the average monthly change of all months). Since 1980, the average February percentage change has been an anemic 0.02% (versus 0.76% for the average of all months). Note that this works out to only 0.3% annualized! However, these are averages, and hide some remarkable exceptions, such as a 7% February rise in 1998 during the Clinton bull market. February was a winning month for the past two years, rising 2.9% in 2010 and 3.2% in 2011, but it lost a whopping 11% in 2009 (taking the prize for the biggest loser in that terrible year), 3.5% in 2008, and 2.2% in 2007. In 2001, seven months prior to the 9/11 attacks, it lost 9.2%. Bottom line: "you pays your money and you takes your chances." Average monthly changes in the S&P 500 show February is a weak month, vying for August for second worst month (September takes that prize).
Average monthly changes in the S&P 500 show February is a weak month, vying for August for second worst month (September takes that prize). [Update: February 2, 2012 (before market open)
This flag was probably too short to really call it one, and the breakout to the upside should be bullish, but the market closed well off its highs which were exactly where it met resistance 4 trading sessions ago. Volume remains unimpressive for a true breakout but at least is higher than 4 of the 5 last down days. Stay tuned; a decisive break above 133 then 135 could lead to a nice rally, but the market seems to be stalling here at least in the short term although the 20-day buy signal remains in place with a stop at 126.43.