Wednesday, November 30, 2011

S&P 500 (SPY @ 124.99) gaps across short term trend line but volume unimpressive

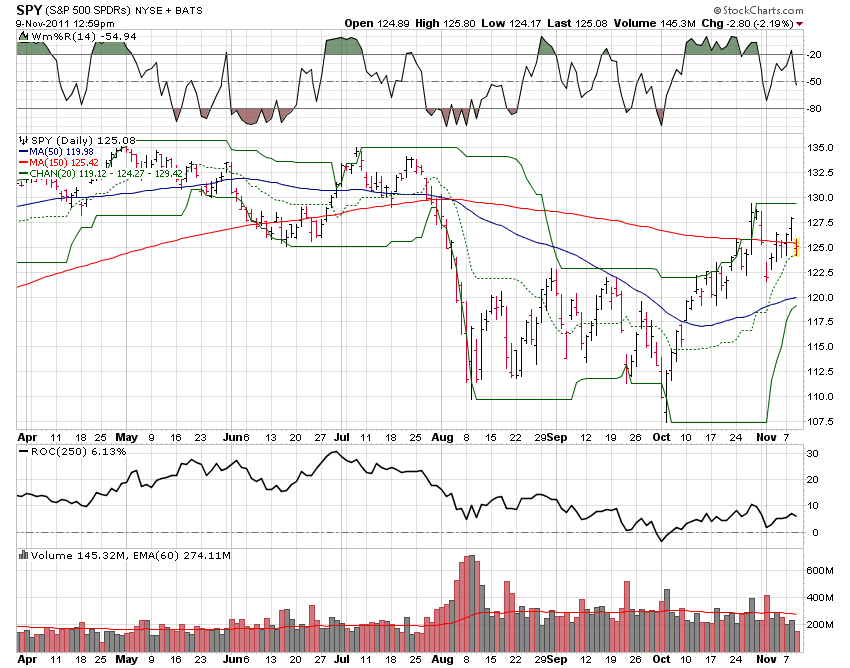
S&P 500 (SPY @ 124.99) gaps across short term trend line then to the midpoint of its 20-day trading range on above average but unimpressive volume.


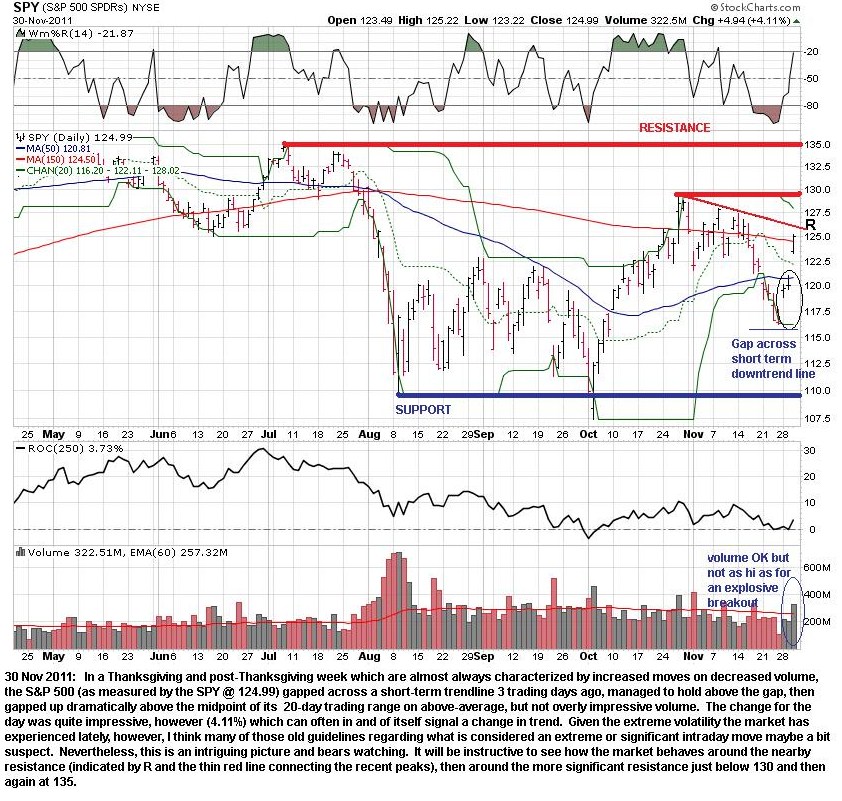
Assessment:  sell signal remains in effect, but watch closely.  Buy stop at 128.02 ( 20-day high).

Thursday, November 24, 2011

S&P 500 (SPY @ 116.56) confirms downturn

S&P 500 (SPY @ 116.56) confirms downturn


The SPY confirmed 3 days ago that the trend is now down and traders should be short, investors flat.  Note that the boring old 20-day high-low system would have had you exit for a small loss this latest buy signal triggered in early October, but kept you from missing the dramatic August decline and sloppy action since then.

However, we can improve quite a bit on this simple system, as I have added little tricks and modifications over the years, a few of which I will discuss below using the chart above to illustrate.

This chart is very busy, but summarizes several key lessons and illustrates how even in a difficult market, it is possible to make money.  This is not theoretical - the trades indicated I actually took and discussed in real time in prior blog entries (long trades are indicated by heavy blue lines from entry point to exit, red lines indicate short positions, from entry to exit - rising blue lines and falling red lines are profitable).

Let's start in July with the short, slightly unprofitable trade followed by a watershed decline that was immensely profitable.  It is absolutely critical to follow the trend if you want to survive and thrive in a market such as this (or any market really although bull markets will often bail you out of many trading errors, making you look and feel smarter than you are - look out!  never confuse brains with a bull market!).  

Although our retrospectoscopes are always 20:20, there were some encouraging signs about what I have indicated as a climax low in August:
    - the market had an enormous surge in volume and had fallen 20% in 2 weeks, most of it in 1 week - never buy ONLY because a market has declined precipitously, but add that to the other pieces of evidence…
    - the huge volume indicated that most of those who wanted to sell had, and the even bigger up volume day on what turned out to be the low of the move was bullish;
    - the market failed to violate the low of this day except for a single trading session intraday in October, which turned out to be a failed breakdown, one of the most bullish signals out there, and combined with the strong up volume indicated this was a relatively low risk entry point (one could sell if the market violated either the 110 or 107.5 lows (take your pick)).   The three following strong up days confirmed this rally which took us all the way back to 130 before stalling.   Had you entered at 112.5, you would have enjoyed a  16% surge.

There were several indications however that the market was in trouble following its peak at "1":
    2 days after forming a high, it closed down sharply, then the next trading day, gapped down on heavy volume (A);
    Although this gap was "filled" meaning a close above the upper boundary of the gap, the market rally stalled at B, then at C, each of which were successively lower highs (bearish).
    Finally, at 3, the market confirmed that the trend had changed, at least for now.  
   
Vic Sperandeo, a legendary trader, has a method of simple trendline analysis that would have gotten you out at an even better price.   His definition of a trend change is a 1-2-3 process (which I have labeled on the chart):
    1.  A properly-drawn trendline (connecting all the lows for an uptrend or all the highs for a downtrend) is violated.  Since this may occur many times without a trend change, in and of itself this is not significant unless:
        - the market gaps across the trendline;
        - the volume of the gap across the trendline is very high; or
        - both.  Both conditions were present at point 1 (or A).
    2.  The market rallies but fails to make a new high.   (A variation allows the market to make a new high but then quickly reverse.)  That situation is found at point 2 (also B).
    3.  Confirmation of the change in trend occurs when the market closes below the lowest low made AFTER breaking the trendline but BEFORE the market attempted (and failed) to form a new high.  

    The easiest way to envision this is as an upside down W:

If you wait until 3, you may leave a lot of money on the table or ride out a lot more volatility than you would like, so Sperandeo advocates assuming a direction change on what he calls a "2b" meaning as soon as it appears the market has failed to make a new high, or better yet, has exceeded it by a point or two, then reversed below it.   This is difficult emotionally to do, since many true breakouts may look like 2b tops but the risk-reward profile is excellent.  You could go short and get stopped out (placing you stop just a few ticks above the high) several times and be right only once to make a lot of money.  Plus, if you are trading options, volatility for puts is often lower when the market is surging to new highs, or seems to be.  
    I got out shortly after A for the reasons listed in 1.  A market gapping down on heavy volume across an uptrend line is not a healthy market.  Had I had more patience and courage, I might have waited until the rally attempt ensued and failed, exiting closer to B, but there was a chance that the market could have simply fallen off a cliff right then and there.  
    Statistically speaking, market tops and bottoms are far more likely to resemble W's (upside down or right-side up) than Vs, meaning you are almost always better off - if you have the stomach (I often don't) - for a market appearing to change trend to approach its recent highs or lows (you can always re-enter if wrong).
    A much more sloppy, but nevertheless similar formation occurred in reverse in early October when the market briefly exceeded but did not follow through on its violation of the climax low.  I cannot count the number of times prior lows form support or turn-around points and prior highs form resistance.  No matter how much some people dismiss technical analysis as voodoo, this simple observation makes it quite clear that markets do have memory if for no other reason than markets are nothing more than the collective behavior of all of its very human participants.  
    Notice also that a similar, less sloppy 1-2-3 pattern occurred in late July when the market broke a shorter trendline (1), failed to make a new high (2) ,then crossed its recent low at 130.  After that, it was a toboggan ride down to the climax low.  
    Again, the idea is not to be perfect - no one is; I'm certainly not - only to avoid (or short) some of the market's worst declines while participating in the bulk of its biggest advances.   A buy and hold investor in the S&P 500 is down over 7% for the year (SPY closed 2010 at 125.75).  At one point, that investor would have been up 7%, at one point down over 20% from the high of the year, so it's been a wild year for those who insist markets cannot be traded.
    Anyone following a trend-following system as simple as the one I present here is in the black for the year.   Not only that, but I slept much better since I spent most of the year in cash and short-term bonds, waiting for the market to tell me what to do next.  
    There is a story unfolding written in price and volume plotted on a chart; perhaps this story remains useful because so many are convinced that it is not!
    Happy Thanksgiving - or, as they call it here in Switzerland, Thursday!

Thursday, November 17, 2011


Thursday, November 17, 2011

SPY Rally seems to have failed


If the market closes below the breakout point (just below 122.5), it would confirm failure of the breakout.  Note the two recent rally attempts were turned back at successively lower highs, and down volume continues to exceed up volume (distribution). 
This is a sloppy, weak market with a lot of fundamental overhang (watch Italy closely).  Washington is a dysfunctional mess with the Know Nothings obstructing any meaningful stimulus and the crop of Republican candidates sans Romney looking like some sort of a freak show rather than the best and brightest of what such an innovative country of 300 million people could produce.  

Wednesday, November 9, 2011

Market rally seems to be stalling below the highs set in late October


Wednesday, November 09, 2011The S&P 500 (SPY 125.00 intraday) is continuing to act top-heavy.  Although a buy signal from 122.5 remains in place with a sell stop now at 119.12 (the 20-day low), as I indicated in my last post, I went flat - perhaps prematurely - because the market was not confirming its breakout.  
In the latest mini-rally, the market continues to show weak volume, far lower than the volume during its massive gap-down sell-off on news of a Greek referendum which although tabled for now has been eclipsed by the far greater problem of Italy's political and debt crisis.  


As always, there are some ambiguous signs, such as the ability of the market to remain (until today) in the upper half of its 20-day range, and what could be hallucinated as a wide and sloppy flag from about 122 to below 130.  Seasonality is also on our side, but little else is.  
What would change my mind?  If the market could decisively clear 130 on heavy volume preferably and remain above it for several days.  Yes, by then one would be buying at higher prices, but so what?  Had you followed the simple 20-day system, you would have been in cash or short since May (I didn't take the July buy signal which led to a small loss) and the market would have to advance substantially for a buy and hold investor to catch up with a trend-follower.

Wednesday, November 2, 2011

Market Alert: Cashing Out, Taking Profits, Going Flat - SPY @ 123.22 intraday


Market Alert:  Cashing Out, Taking Profits, Going Flat - SPY @ 123.22 intraday
Wed 11/2/11 6:00 pm Swiss time (GMT+1)

In a market like this, you have to be nimble.  I do not understand what is happening, but will not wait around to find out.  I can always re-enter later if I am premature, but I just cashed out, locking in profits on all positions (I closed my Euro position the day prior to the Greek referndum announcement).
Normally, I would wait for more confirmation of a change in trend, but the market's action is simply not healthy:

 - After a very healthy, robust, good volume advance last week, the S&P 500 not only stalled, but sold off just as sharply on even higher volume.   A failed signal (failure to follow through in this case on a breakout) is one of the most reliable fo all signals - although it's a little early to call this breakout a failure, we don't need to wait for the rocket to completely fall back to Earth before ejecting;
 - Downside gap was not even close to filled; volume so far today is unimpressive; this is a snapback rally, often the best chance to get out at a good price;
 - Never let a profit turn into a loss; green ink was showing on all positions before I pulled the trigger today; I would rather take a short, sweet profit than wait around and wonder what hit me;
 - Although I tend to ignore fundamentals as a rule, the Greek action is concerning (from a financial point of view); I actually agree with the protestors filling the streets of most countries that imposing austerity on the many to pay for the transgressions of a privileged, reckless few is immoral and unlikely to change the behavior of those who got us into this financial mess.  Nevertheless, it will take the financial markets a bit of time to get used to this new paradigm - expect referenda in other countries facing austerity measures.  The IMF model - punishing countries essentially for being poor and in debt by slashing their public services to the poor and retired so that wealth bankers can be made whole again - is deeply flawed but until this point has never been so bluntly challenged.   I will wait on the sidelines until this sorts itself out.  The United States was hurt not so much by a weak economy as by its complete political paralysis, held hostage by zealots who believe that slashing taxes and imposing austerity in a time of crisis is a great idea.   Now the same thing might occur in Europe with fissures between the other EU members, duct-taped over with the latest bailout package to Greece, at high risk of leading to absolutely no net effective action.   While the doctors are arguing (and some are arguing for bleeding the bad humors out of the patient and in the United States and the UK have gotten their way), the patient has hardly begun to recover.  This is not good.