Tuesday, April 05, 2011: SPY @ 133.34 (intraday). Technically, the market has just issued a buy signal, but I am going to go out on a limb and do something I almost never do, and recommend no one else do (much) either: ignore it.
When the market broke its 20-day low and issued a sell signal in mid-March, it looked as though a significant decline punctuated by a failed rally or two was in the works. As it turns out, the market climbed a wall of worry, paused at its midrange point, then kept climbing. 2 trading days later, it poked above its trailing 20-day high, which should signal a buy signal and resumption of the uptrend.

Although I will likely regret it, there are several reasons why I am overriding this buy signal at least for now:
- The market has gotten ahead of itself, at least in the short term; I do not believe in the terms overbought or oversold - a market can always go higher or lower than anyone can imagine and the worst reason to avoid buying a market is because it is higher than it was a week or two ago (in fact, that is usually the best time to buy a market); but 8 points in a little over 2 weeks is a bit much with no low lower than the prior 3-day low;
- Volume, although a bit higher on some of the up days than most of the down days during this rally is still way below the overwhelming down volume of the last leg down; in other words, distribution (net selling of shares) is still going on - the market is moving higher but on below average volume whereas the decline was on above average volume;
- Major resistance at around 134 where the market peaked in late February before sharply selling off; if this resistance is decisively cleared, then my mind could change but until then, I believe the next leg will be down rather than up;
- A broken uptrend line connecting the lows of September and November remains in effect; in fact, this could be what Vic Sperandeo calls a "2b top" where you have breaking of an uptrend line, then failure to take out, or brief penetration of the high prior to the breaking of this uptrend line, followed by confirmation of the change in trend as prices fall below the low between the two highs;
- Intramonth seasonality: the market tends to get a nice pop around the end of the month, typically the last couple trading days of one month and the first couple of the next (entire trading systems have been built around this remarkably consistent tendency); this is the weakest of all reasons to sell, but it would not have been surprising to have the market rally into the end of March and first few days of April, only to give back those gains as the month wears on.
I still like the Euro (FXE @ 141.69):

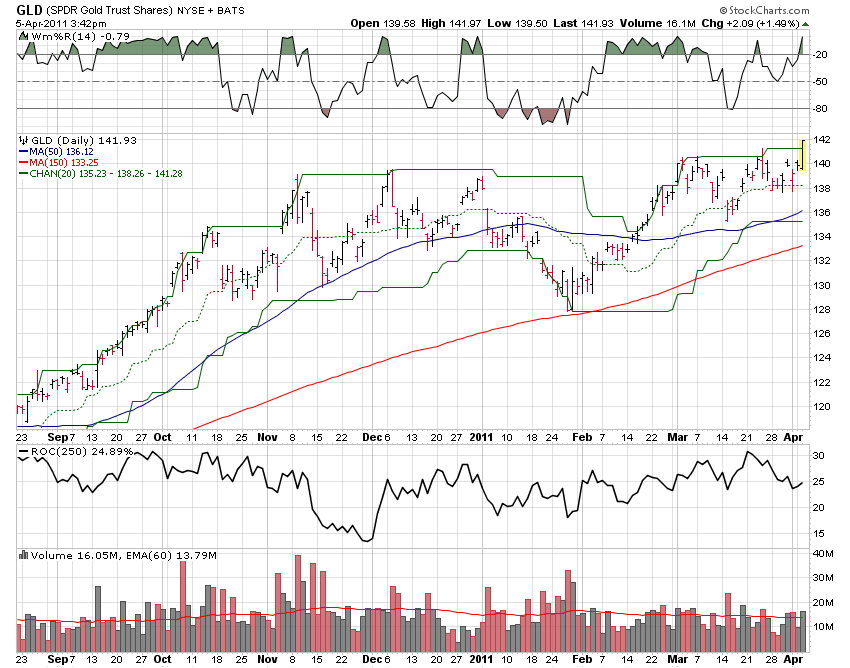
… and Gold (GLD @ 141.88) which had a very strong day today, clearing its 20-day high on decent volume:
Stay tuned!