
The S&P 500 continues to show a nice, orderly advance, with higher highs and higher lows. The market action this year has been a textbook case in why trend-following works. Unfortunately, it's not always so simple. In fact, markets spend most of their times in trading ranges, not in clearly defined trends and of course trends are not clearly defined until after the fact. But when markets do trend and a trend has been declared, there is plenty of money to be made. You can never buy the bottom or sell the top, but you don't need to.
Take the action since January as an example. Following a break-out at 108.65 in October, 2011, (not shown), the S&P 500 didn't look back, rising 30%to 141.40 before triggering a sell signal (20 day trailing low) at just below 136 for a locked-in profit of 25%. Notice how the prior high of 141.40 proved to be almost the exact turning point for the aborted rally in late April, giving you an easy, nice double top. You could have shorted the market at this point with a buy stop (to cover your short) just above 141.40 and you would have had a nice 11% profit peak-to-trough. You would cover shortly after the gap up opening on the third trading day of June indicated the sell off below the prior low of 128.88 was false (a failed signal is the most powerful signal). Even if you entered on the close of that day or the open of the next, you would have covered your short and gone long at around 131, a respectable 7% profit in a little over a month. At any rate, the 20-day high would have gotten you into the market just above 133, after which point you would have shown as much as an 8% open profit (currently down a bit to 5.9%). So simply by using a brute force, mechanical system that didn't try to pretend it knew why the market was doing what it was, you would have been ahead 38% since October of last year (assuming you compounded your gains, changing your position size to reflect your increased profits), a bit more if you tried to anticipate using Sperandeo's "2b" highs and lows). Not bad for a mindless system that generated only 4 signals over that time period!Note that anyone who says that markets don't have memory need only look at this chart as pretty strong counter-proof. Markets as inanimate abstractions of course do not have memory, but the very human participants whose behavior is measured as market action do. They remember the pain of loss and the hope of further gain. They know exactly whether their break-even point is, and where they promise themselves to "get out even" (which is why prior recent highs are often resistance, or turn-around points for a rally as it morphs into a trading range). They experience the regret of missing the last rally, promising themselves they will buy if the market gets close to its last low, making that low a rallying point. Finally, they often realize very quickly when they get ahead of themselves, as they did following the market break-down below support in June, scrambling to cover their shorts or go long as the market gapped up above not just the new but the old low.
Note that anyone who says that markets don't have memory need only look at this chart as pretty strong counter-proof. Markets as inanimate abstractions of course do not have memory, but the very human participants whose behavior is measured as market action do. They remember the pain of loss and the hope of further gain. They know exactly whether their break-even point is, and where they promise themselves to "get out even" (which is why prior recent highs are often resistance, or turn-around points for a rally as it morphs into a trading range). They experience the regret of missing the last rally, promising themselves they will buy if the market gets close to its last low, making that low a rallying point. Finally, they often realize very quickly when they get ahead of themselves, as they did following the market break-down below support in June, scrambling to cover their shorts or go long as the market gapped up above not just the new but the old low.
Gold looks interesting....

The same principles can be applied, perhaps more profitably, to individual stocks, but my experience has been that individual stock trading is far more choppy and tends to issue far more false buy and sell signals than trading markets or sectors (through ETFs or mutual funds). If you like Apple, you are probably better off buying the technology sector (through XLK) if you want to sleep at night, but can do quite well if you are prepared for getting shaken out of a position several times for a loss before finally riding the big trend into the financial heavens.
One company with a beautiful "trend-worthy" chart right now is Target (TGT). By the way, with stocks, I recommend doing some fundamental research, unlike with markets (where I believe fundamental research is often misleading or less than worthless). If you don't like pouring over balance sheets and income statements, then plenty of excellent third party vendors are available. Plenty of terrible ones are also, but two that have outstanding long-term records are Value Line (subscription only but most libraries subscribe, giving you free access) or Microsoft's Stock Scouter. The latter uses a quantitative method that ranks stocks into deciles (sort of) from one (worst) to 10 (best). Try to limit your choices for long stocks to 7-10. Target, when I bought, was a 7 (I will only sell on technicals even if I bought on a combination of technicals and fundamentals).
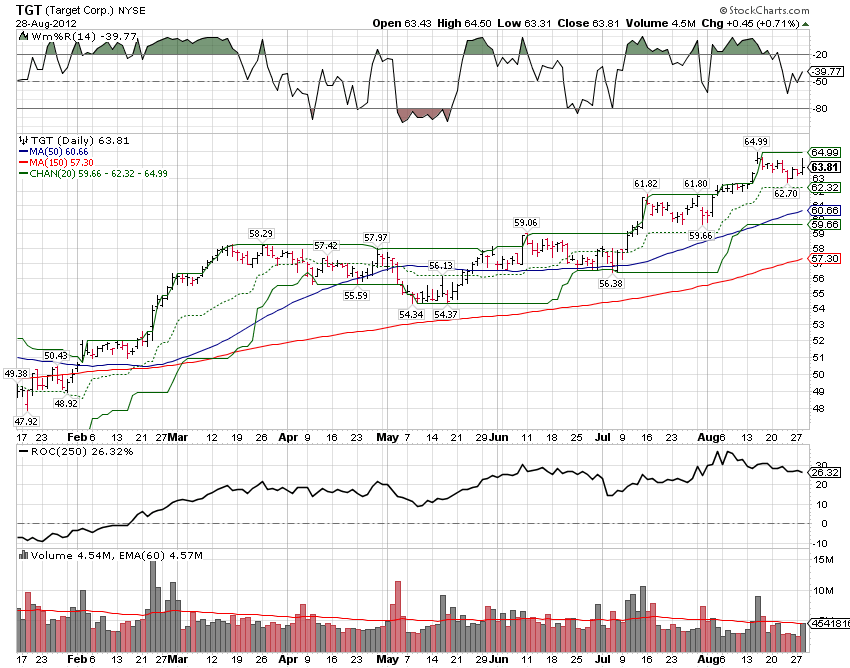
Why am I so enamored of Target? First, it's a great company that I use personally (the Peter Lynch approach). Second, it's got a good, solid fundamental ranking which means it merits further consideration. Third, its chart is beautiful.
Since its June breakout, TGT has had at least 3 distinctive trading ranges in an obvious staircase pattern with higher highs and higher lows. It looks as though it is ready to test its recent high around 65 after which one could anticipate this would form support of a new, higher trading range. Of course, it could fail that test, re-enter the current trading range and back and fill some more, or, a third possibility, sell off. But before it does option 3, it must first violate its 20-day low, currently at 59.66 (and soon to move much higher, giving you less risk).
More later...


