A collection of studies, articles, and data series I've collected over the years on stocks and options.
Showing posts with label spx seasonality. Show all posts
Friday, March 22, 2013
Monday, September 3, 2012
Labor Day and the S&P 500: the market rises 48.3% annualized the day prior to Labor Day and 28.8% annualized the day after...
Labor Day and Stock Market: the day before and after the holiday tend to rise.
One of the most fascinating aspects of the stock market is its tendency to rise shortly before and after holidays. The reason this is fascinating is that it continues to persist despite widespread publicity. The efficient market hypothesis (and common sense) dictate that if the market tends to rise on a given day, once this observation becomes widely known then people will buy the day before, changing the pattern or making it useless. Yet seasonality shows no sign of going away anytime soon.
Labor Day is a profitable holiday to trade around as the table below shows. To construct this table, I calculated the percentage change in the S&P 500 from 1980 to the present, then calculated the average percentage change as well as the percentage of times the market rose:
A few things jump out:
The day prior to and immediately following Labor Day are most profitable, rising 0.16% and 0.10% on average. This may not sound impressive until you consider that this is only a single trading day; annualized, it works out to an impressive 48.3% and 28.8% respectively).
Interestingly, the days before and after this profitable period tend to be weak with the market falling almost two-thirds of the time the second-to-last trading day prior Labor Day, and losing .22% on average on the third trading day following Labor Day.
The market rose 58% of the days prior to Labor Day.
As with any seasonal pattern, of course, this should be used as one of many factors when making a trading decision. If you are considering going long the market anyway, it might make sense to buy at the open the day prior to Labor Day, and if you are considering selling, to wait until the close following Labor Day.
One of the most fascinating aspects of the stock market is its tendency to rise shortly before and after holidays. The reason this is fascinating is that it continues to persist despite widespread publicity. The efficient market hypothesis (and common sense) dictate that if the market tends to rise on a given day, once this observation becomes widely known then people will buy the day before, changing the pattern or making it useless. Yet seasonality shows no sign of going away anytime soon.
Labor Day is a profitable holiday to trade around as the table below shows. To construct this table, I calculated the percentage change in the S&P 500 from 1980 to the present, then calculated the average percentage change as well as the percentage of times the market rose:
| Labor Day | |||||||
Avg: | -0.15% | 0.16% | 0.10% | 0.03% | -0.22% | ||
Annzd: | -31.7% | 48.3% | 28.8% | 6.8% | -41.6% | ||
Close%: | 39% | 58% | 50% | 53% | 50% | ||
| Labor Day falls on: | -2 | -1 | Labor Day | 1 | 2 | 3 | |
1980 | 1-Sep | -1.2% | 0.2% | 1.1% | 1.9% | -0.6% | |
1981 | 7-Sep | 0.4% | -1.8% | -1.0% | -1.7% | 0.4% | |
1982 | 6-Sep | 1.7% | 2.0% | -1.1% | 0.7% | -0.2% | |
1983 | 5-Sep | -0.1% | 0.5% | 1.8% | 0.0% | -0.1% | |
1984 | 3-Sep | -0.3% | 0.0% | -1.1% | -0.4% | 0.8% | |
1985 | 2-Sep | 0.1% | -0.2% | -0.4% | -0.3% | -0.1% | |
1986 | 1-Sep | -0.2% | 0.0% | -1.7% | 0.6% | 1.5% | |
1987 | 7-Sep | -0.5% | -1.1% | -1.0% | 0.1% | 1.0% | |
1988 | 5-Sep | -1.2% | 2.4% | 0.4% | 0.1% | 0.0% | |
1989 | 4-Sep | 0.2% | 0.6% | -0.3% | -0.9% | -0.3% | |
1990 | 3-Sep | -1.7% | 1.2% | 0.2% | 0.4% | -1.2% | |
1991 | 2-Sep | 0.0% | -0.3% | -0.8% | -0.6% | -0.2% | |
1992 | 7-Sep | 0.3% | -0.2% | 0.5% | 0.5% | 0.0% | |
1993 | 6-Sep | -0.4% | 0.0% | -0.6% | -0.4% | 0.2% | |
1994 | 5-Sep | -0.5% | -0.5% | 0.2% | -0.2% | 0.5% | |
1995 | 4-Sep | 0.2% | 0.3% | 0.9% | 0.2% | 0.0% | |
1996 | 2-Sep | -1.1% | -0.8% | 0.4% | 0.1% | -0.9% | |
1997 | 1-Sep | -1.1% | -0.5% | 3.1% | 0.0% | 0.3% | |
1998 | 7-Sep | -0.8% | -0.9% | 5.1% | -1.7% | -2.6% | |
1999 | 6-Sep | -0.9% | 2.9% | -0.5% | -0.5% | 0.3% | |
2000 | 4-Sep | 1.0% | 0.2% | -0.9% | -1.0% | 0.7% | |
2001 | 3-Sep | -1.7% | 0.4% | -0.1% | -0.1% | -2.2% | |
2002 | 2-Sep | 0.0% | -0.2% | -4.2% | 1.8% | -1.6% | |
2003 | 1-Sep | 0.6% | 0.5% | 1.4% | 0.4% | 0.2% | |
2004 | 6-Sep | 1.1% | -0.4% | 0.7% | -0.4% | 0.2% | |
2005 | 5-Sep | 0.1% | -0.3% | 1.3% | 0.2% | -0.4% | |
2006 | 4-Sep | -0.1% | 0.6% | 0.2% | -1.0% | -0.5% | |
2007 | 3-Sep | -0.4% | 1.1% | 1.0% | -1.2% | 0.4% | |
2008 | 1-Sep | 1.5% | -1.4% | -0.4% | -0.2% | -3.0% | |
2009 | 7-Sep | 0.9% | 1.3% | 0.9% | 0.8% | 1.0% | |
2010 | 6-Sep | 0.9% | 1.3% | -1.1% | 0.6% | 0.5% | |
2011 | 5-Sep | -1.0% | -2.6% | -0.7% | 2.8% | -1.0% | |
2012 | 3-Sep | -0.7% | 0.5% |
A few things jump out:
The day prior to and immediately following Labor Day are most profitable, rising 0.16% and 0.10% on average. This may not sound impressive until you consider that this is only a single trading day; annualized, it works out to an impressive 48.3% and 28.8% respectively).
Interestingly, the days before and after this profitable period tend to be weak with the market falling almost two-thirds of the time the second-to-last trading day prior Labor Day, and losing .22% on average on the third trading day following Labor Day.
The market rose 58% of the days prior to Labor Day.
As with any seasonal pattern, of course, this should be used as one of many factors when making a trading decision. If you are considering going long the market anyway, it might make sense to buy at the open the day prior to Labor Day, and if you are considering selling, to wait until the close following Labor Day.
Friday, May 11, 2012
Market update - SPY (@ 136.02 prior to market open 5/11/12) looks very bearish
May 11, 2012: Market update: SPY (@ 136.02 prior to market open) is looking very bearish. See chart below for more details.


Interestingly, this chart looks similar to that of almost exactly a year ago:
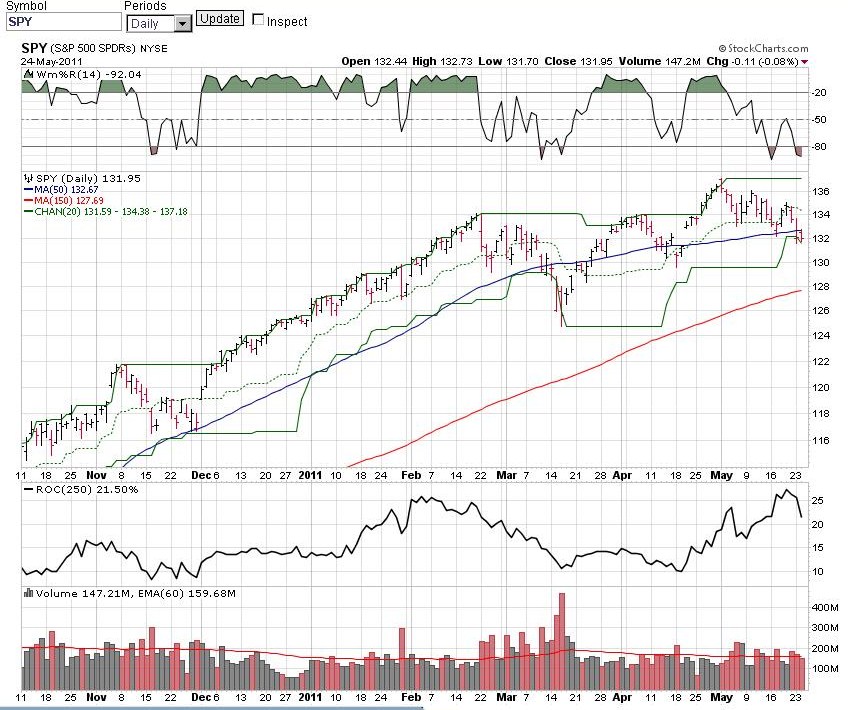
In
both cases, the market had rallied from lows in October and November to
peaks in April - last year's chart was far more bullish because the
peak in April was taken out in May and the market managed to trade above
this level for a month or so.
As of late May, however, the market began breaking down and issued a sell signal when it violated its 20-day trailing low:
This was a timely sell signal, since the market collapsed in August, which has become a very weak and dangerous month:
The
market tried to rally but critically did not take out its 20-day high.
Note that markets rarely form V bottoms, rallying off of steep
declines. Instead, they tend to rally back, usually sharply and
dramatically. It is not uncommon for it to take out between a third
and a half of the sell-off (peak to trough), which is exactly what
happened here: the market sold off from 135 to 110 (25 points) then
rallied to the 122.5 areas - a retracement of almost exactly 50% of the
sell-off. Then it stalled, backed and filled, then broke down on a gap
on heavy volume:
Marching
forward, the market tried to rally again, failed, and found support at
its prior low (turning the V into a W). An aggressive, nimble trader (I
unfortunately am neither) could have taken a position at the market
close in early October when 3 things happened at once: 1.) the August
low was violated, but there was no follow-through (a failed sell signal -
bullish); 2.) the market set a new low but closed sharply higher for
the day (key reversal); 3.) the market was in a 2-b situation where the
sharp down trend-line was broken (1), the market failed to make a new
low (2), and was still very close to that new low. A stop could have
been placed either at the low of the day or where apparent support now
resided, just beyond the August low.
Subscribe to:
Comments (Atom)
